15:47 | 15/07/2022
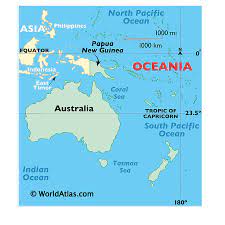
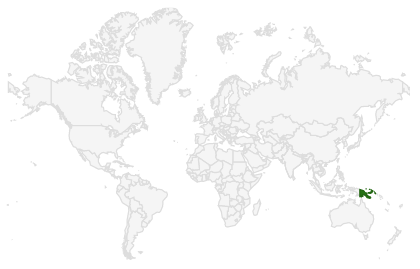
Papua New Guinea. Population: 9,306,091.
Land area: 452,860 Km2 (174,850 sq. miles), Capital: Port Moresby
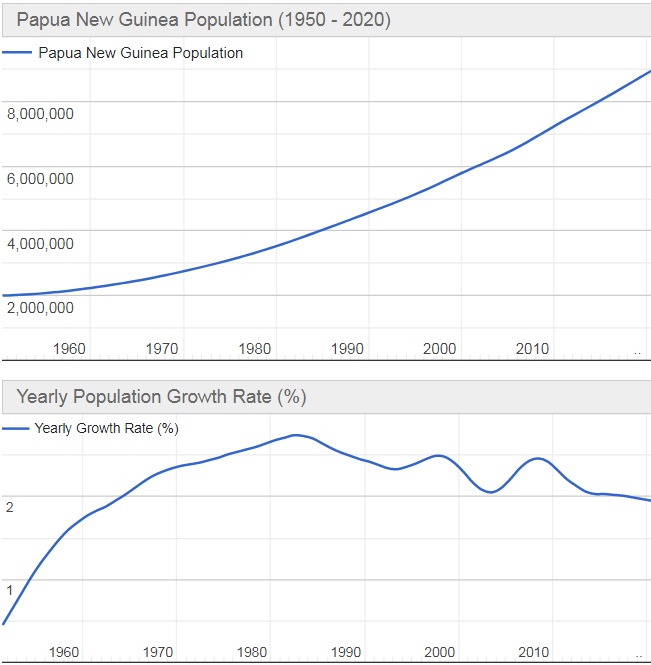
- The current population of Papua New Guinea is 9,290,895 as of Friday, July 15, 2022, based on Worldometer elaboration of the latest United Nations data.
- Papua New Guinea 2020 population is estimated at 8,947,024 people at mid year according to UN data.
- Papua New Guinea population is equivalent to 0.11% of the total world population.
- Papua New Guinea ranks number 98 in the list of countries (and dependencies) by population.
- The population density in Papua New Guinea is 20 per Km2 (51 people per mi2).
- The total land area is 452,860 Km2 (174,850 sq. miles)
- 13.1 % of the population is urban (1,168,469 people in 2020)
- The median age in Papua New Guinea is 22.4 years.
![]()
Population of Papua New Guinea
| Year | Population | Yearly% Change |
Yearly Change |
Migrants (net) | Median Age | Fertility Rate | Density (P/Km²) | Urban Pop % |
Urban Population | World Population | Global Rank |
|---|---|---|---|---|---|---|---|---|---|---|---|
| 2020 | 8,947,024 | 1.95 % | 170,915 | -800 | 22.4 | 3.59 | 20 | 13.1 % | 1,168,469 | 7,794,798,739 | 98 |
| 2019 | 8,776,109 | 1.97 % | 169,786 | -800 | 21.7 | 3.79 | 19 | 13.0 % | 1,137,684 | 7,713,468,100 | 98 |
| 2018 | 8,606,323 | 1.99 % | 168,287 | -800 | 21.7 | 3.79 | 19 | 12.9 % | 1,108,588 | 7,631,091,040 | 99 |
| 2017 | 8,438,036 | 2.01 % | 166,274 | -800 | 21.7 | 3.79 | 19 | 12.8 % | 1,081,089 | 7,547,858,925 | 100 |
| 2016 | 8,271,762 | 2.02 % | 163,987 | -800 | 21.7 | 3.79 | 18 | 12.8 % | 1,055,101 | 7,464,022,049 | 100 |
| 2015 | 8,107,775 | 2.09 % | 159,454 | -800 | 21.5 | 3.84 | 18 | 12.7 % | 1,030,539 | 7,379,797,139 | 100 |
| 2010 | 7,310,507 | 2.39 % | 163,121 | 7,716 | 20.9 | 4.13 | 16 | 12.7 % | 925,387 | 6,956,823,603 | 101 |
| 2005 | 6,494,903 | 2.12 % | 129,463 | -16,883 | 20.4 | 4.39 | 14 | 12.7 % | 827,808 | 6,541,907,027 | 101 |
| 2000 | 5,847,586 | 2.43 % | 132,105 | -5,216 | 19.8 | 4.64 | 13 | 12.6 % | 735,741 | 6,143,493,823 | 102 |
| 1995 | 5,187,060 | 2.36 % | 114,244 | -4,223 | 19.3 | 4.70 | 11 | 13.3 % | 689,139 | 5,744,212,979 | 103 |
| 1990 | 4,615,839 | 2.49 % | 106,962 | 945 | 18.7 | 4.97 | 10 | 14.0 % | 646,717 | 5,327,231,061 | 106 |
| 1985 | 4,081,030 | 2.70 % | 101,965 | 2,141 | 18.2 | 5.47 | 9 | 13.0 % | 531,198 | 4,870,921,740 | 109 |
| 1980 | 3,571,205 | 2.61 % | 86,252 | -1,729 | 18.0 | 5.87 | 8 | 12.1 % | 431,144 | 4,458,003,514 | 111 |
| 1975 | 3,139,945 | 2.44 % | 71,365 | -1,284 | 18.0 | 6.09 | 7 | 10.9 % | 343,361 | 4,079,480,606 | 112 |
| 1970 | 2,783,121 | 2.29 % | 59,537 | 1,895 | 18.0 | 6.21 | 6 | 8.9 % | 247,610 | 3,700,437,046 | 114 |
| 1965 | 2,485,437 | 1.96 % | 45,916 | 1,172 | 18.2 | 6.28 | 5 | 4.9 % | 122,314 | 3,339,583,597 | 113 |
| 1960 | 2,255,859 | 1.58 % | 33,922 | 631 | 18.9 | 6.26 | 5 | 3.3 % | 74,897 | 3,034,949,748 | 113 |
| 1955 | 2,086,247 | 0.83 % | 16,820 | -2,465 | 19.5 | 6.24 | 5 | 2.2 % | 46,008 | 2,773,019,936 | 113 |
![]()
Papua New Guinea Population Forecast
| Year | Population | Yearly% Change |
Yearly Change |
Migrants (net) | Median Age | Fertility Rate | Density (P/Km²) | Urban Pop% |
Urban Population | World Population | Global Rank |
|---|---|---|---|---|---|---|---|---|---|---|---|
| 2020 | 8,947,024 | 1.99 % | 167,850 | -800 | 22.4 | 3.59 | 20 | 13.1 % | 1,168,469 | 7,794,798,739 | 98 |
| 2025 | 9,817,926 | 1.88 % | 174,180 | -800 | 23.4 | 3.59 | 22 | 13.8 % | 1,351,201 | 8,184,437,460 | 95 |
| 2030 | 10,709,348 | 1.75 % | 178,284 | -800 | 24.4 | 3.59 | 24 | 14.9 % | 1,592,390 | 8,548,487,400 | 93 |
| 2035 | 11,606,999 | 1.62 % | 179,530 | -800 | 25.3 | 3.59 | 26 | 16.5 % | 1,909,467 | 8,887,524,213 | 87 |
| 2040 | 12,492,600 | 1.48 % | 177,120 | -800 | 26.3 | 3.59 | 28 | 18.5 % | 2,316,480 | 9,198,847,240 | 87 |
| 2045 | 13,360,907 | 1.35 % | 173,661 | -800 | 27.2 | 3.59 | 30 | 20.9 % | 2,789,827 | 9,481,803,274 | 86 |
| 2050 | 14,204,066 | 1.23 % | 168,632 | 28.0 | 3.59 | 31 | 23.4 % | 3,325,555 | 9,735,033,990 | 84 |
![]()
Main Cities by Population in Papua New Guinea
| # | CITY NAME | POPULATION | ||
|---|---|---|---|---|
| 1 | Port Moresby | 283,733 | ||
| 2 | Lae | 76,255 | ||
| 3 | Arawa | 40,266 | ||
| 4 | Mount Hagen | 33,623 | ||
| 5 | Popondetta | 28,198 | ||
| 6 | Madang | 27,419 | ||
| 7 | Kokopo | 26,273 | ||
| 8 | Mendi | 26,252 | ||
| 9 | Kimbe | 18,847 | ||
| 10 | Goroka | 18,503 | ||
| 11 | Wewak | 18,230 | ||
| 12 | Bulolo | 16,042 | ||
| 13 | Daru | 15,214 |
![]()