06:19 | 16/07/2022
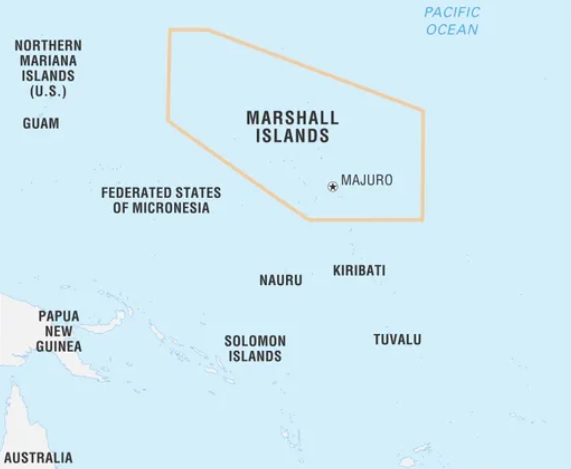
Marshall Islands. Population: 60,013
Land area: 180 Km2 (69 sq. miles). Capital: Majuro
- The current population of the Marshall Islands is 60,000 as of Friday, July 15, 2022, based on the latest United Nations estimates.
- The Marshall Islands population is equivalent to 0.00076% of the total world population.
- The Marshall Islands ranks number 207 in the list of countries (and dependencies) by population.
- The population density in the Marshall Islands is 329 per Km2 (852 people per mi2).
- The total land area is 180 Km2 (69 sq. miles)
- 70.0 % of the population is urban (41,426 people in 2020)
![]()
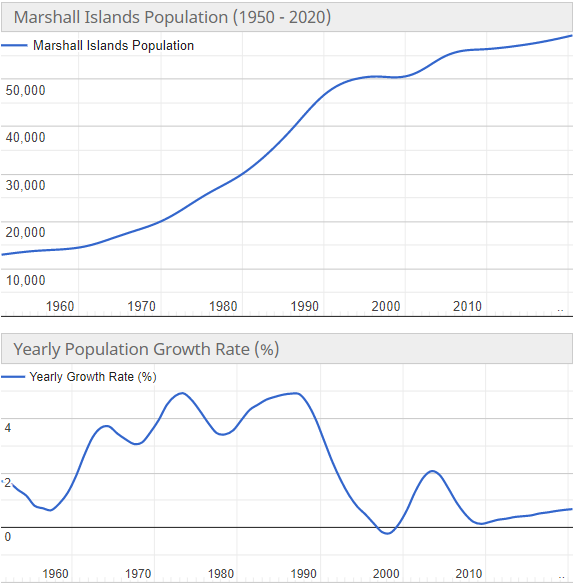
Population of the Marshall Islands
| Year | Population | Yearly% Change |
Yearly Change |
Density (P/Km²) | Urban Pop% |
Urban Population | World Population | Global Rank |
|---|---|---|---|---|---|---|---|---|
| 2020 | 59,190 | 0.6 % | 350 | 329 | 70 % | 41,426 | 7,794,798,739 | 207 |
| 2019 | 58,791 | 0.65 % | 378 | 327 | 70.1 % | 41,195 | 7,713,468,100 | 207 |
| 2018 | 58,413 | 0.61 % | 355 | 325 | 70.1 % | 40,955 | 7,631,091,040 | 207 |
| 2017 | 58,058 | 0.56 % | 323 | 323 | 70.1 % | 40,714 | 7,547,858,925 | 207 |
| 2016 | 57,735 | 0.52 % | 296 | 321 | 70.1 % | 40,451 | 7,464,022,049 | 207 |
| 2015 | 57,439 | 0.38 % | 215 | 319 | 69.9 % | 40,175 | 7,379,797,139 | 207 |
| 2010 | 56,366 | 0.4 % | 222 | 313 | 68.4 % | 38,568 | 6,956,823,603 | 208 |
| 2005 | 55,258 | 1.72 % | 901 | 307 | 67 % | 37,031 | 6,541,907,027 | 209 |
| 2000 | 50,753 | 0.12 % | 59 | 282 | 70.5 % | 35,771 | 6,143,493,823 | 209 |
| 1995 | 50,457 | 1.31 % | 637 | 280 | 67.5 % | 34,041 | 5,744,212,979 | 208 |
| 1990 | 47,271 | 4.28 % | 1,788 | 263 | 65.1 % | 30,769 | 5,327,231,061 | 209 |
| 1985 | 38,333 | 4.63 % | 1,551 | 213 | 61.9 % | 23,745 | 4,870,921,740 | 210 |
| 1980 | 30,576 | 3.64 % | 1,000 | 170 | 58.3 % | 17,825 | 4,458,003,514 | 210 |
| 1975 | 25,576 | 4.63 % | 1,036 | 142 | 60.6 % | 15,507 | 4,079,480,606 | 211 |
| 1970 | 20,395 | 3.37 % | 622 | 113 | 53.5 % | 10,910 | 3,700,437,046 | 214 |
| 1965 | 17,284 | 3.35 % | 524 | 96 | 23.4 % | 4,040 | 3,339,583,597 | 214 |
| 1960 | 14,662 | 1.08 % | 154 | 81 | 35.6 % | 5,217 | 3,034,949,748 | 214 |
| 1955 | 13,894 | 1.34 % | 179 | 77 | 29.1 % | 4,040 | 2,773,019,936 | 214 |
![]()
The Marshall Islands Population Forecast
| Year | Population | Yearly% Change |
Yearly Change |
Density (P/Km²) | Urban Pop% |
Urban Population | World Population | Global Rank |
|---|---|---|---|---|---|---|---|---|
| 2020 | 59,190 | 0.6 % | 350 | 329 | 70 % | 41,426 | 7,794,798,739 | 207 |
| 2025 | 61,604 | 0.8 % | 483 | 342 | 69.3 % | 42,714 | 8,184,437,460 | 207 |
| 2030 | 65,000 | 1.08 % | 679 | 361 | 69.4 % | 45,100 | 8,548,487,400 | 206 |
| 2035 | 68,326 | 1 % | 665 | 380 | 70.6 % | 48,270 | 8,887,524,213 | 206 |
| 2040 | 71,270 | 0.85 % | 589 | 396 | 72.5 % | 51,690 | 9,198,847,240 | 206 |
| 2045 | 73,605 | 0.65 % | 467 | 409 | 74.1 % | 54,573 | 9,481,803,274 | 205 |
| 2050 | 75,365 | 0.47 % | 352 | 419 | 74.9 % | 56,454 | 9,735,033,990 | 205 |
![]()
![]()
 << Countries around the world >>
![]()
Related Posts