04:52 | 11/06/2022
![]()
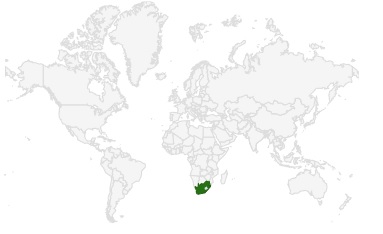
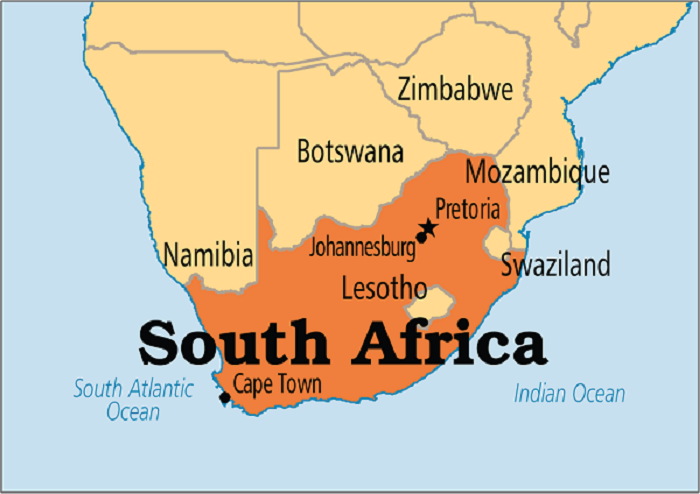
South Africa. Population: 60,796,485.
Land area:1,213,090 Km2 (468,376 sq. miles). Capital: Cape Town

- The current population of South Africa is 60,754,408 as of Friday, June 10, 2022, based on Worldometer elaboration of the latest United Nations data.
- South Africa 2020 population is estimated at 59,308,690 people at mid year according to UN data.
- South Africa population is equivalent to 0.76% of the total world population.
- South Africa ranks number 25 in the list of countries (and dependencies) by population.
- The population density in South Africa is 49 per Km2 (127 people per mi2).
- The total land area is 1,213,090 Km2 (468,376 sq. miles)
- 66.7 % of the population is urban (39,550,889 people in 2020)
- The median age in South Africa is 27.6 years.
![]()
Population of South Africa (2020 and historical)
| Year | Population | Yearly% Change |
Yearly Change |
Migrants (net) | Median Age | Fertility Rate | Density (P/Km²) | Urban Pop% |
Urban Population | World Population | Global Rank |
|---|---|---|---|---|---|---|---|---|---|---|---|
| 2020 | 59,308,690 | 1.28 % | 750,420 | 145,405 | 27.6 | 2.41 | 49 | 66.7% | 39,550,889 | 7,794,798,739 | 25 |
| 2019 | 58,558,270 | 1.33 % | 765,752 | 145,405 | 26.6 | 2.52 | 48 | 66.3% | 38,820,239 | 7,713,468,100 | 24 |
| 2018 | 57,792,518 | 1.37 % | 782,762 | 145,405 | 26.6 | 2.52 | 48 | 65.9% | 38,086,769 | 7,631,091,040 | 24 |
| 2017 | 57,009,756 | 1.43 % | 802,110 | 145,405 | 26.6 | 2.52 | 47 | 65.5% | 37,348,154 | 7,547,858,925 | 24 |
| 2016 | 56,207,646 | 1.48 % | 821,279 | 145,405 | 26.6 | 2.52 | 46 | 65.1% | 36,600,982 | 7,464,022,049 | 24 |
| 2015 | 55,386,367 | 1.58 % | 833,881 | 183,939 | 26.4 | 2.55 | 46 | 64.7% | 35,844,349 | 7,379,797,139 | 24 |
| 2010 | 51,216,964 | 1.36 % | 667,273 | 172,444 | 25.0 | 2.63 | 42 | 62.7% | 32,094,811 | 6,956,823,603 | 24 |
| 2005 | 47,880,601 | 1.26 % | 582,579 | 157,796 | 23.8 | 2.61 | 39 | 60.7% | 29,065,720 | 6,541,907,027 | 26 |
| 2000 | 44,967,708 | 1.65 % | 706,390 | 127,980 | 22.6 | 2.88 | 37 | 57.9% | 26,015,136 | 6,143,493,823 | 27 |
| 1995 | 41,435,758 | 2.40 % | 927,050 | 170,572 | 21.3 | 3.51 | 34 | 55.3% | 22,932,019 | 5,744,212,979 | 27 |
| 1990 | 36,800,509 | 2.40 % | 824,327 | -23,600 | 19.8 | 4.40 | 30 | 53.1% | 19,545,369 | 5,327,231,061 | 28 |
| 1985 | 32,678,874 | 2.73 % | 824,421 | 36,200 | 19.5 | 4.90 | 27 | 51.0% | 16,653,360 | 4,870,921,740 | 28 |
| 1980 | 28,556,769 | 2.54 % | 672,316 | 14,663 | 19.4 | 5.05 | 24 | 50.5% | 14,411,610 | 4,458,003,514 | 28 |
| 1975 | 25,195,187 | 2.68 % | 625,082 | 44,532 | 19.3 | 5.50 | 21 | 50.1% | 12,610,547 | 4,079,480,606 | 29 |
| 1970 | 22,069,776 | 2.63 % | 536,987 | 39,872 | 19.1 | 5.80 | 18 | 49.5% | 10,919,359 | 3,700,437,046 | 29 |
| 1965 | 19,384,841 | 2.54 % | 457,000 | 21,310 | 19.4 | 6.00 | 16 | 48.6% | 9,422,320 | 3,339,583,597 | 31 |
| 1960 | 17,099,840 | 2.37 % | 378,668 | 2,984 | 19.9 | 6.05 | 14 | 47.6% | 8,138,204 | 3,034,949,748 | 31 |
| 1955 | 15,206,502 | 2.22 % | 315,615 | 1,492 | 20.6 | 6.05 | 13 | 44.9% | 6,829,341 | 2,773,019,936 | 31 |
![]()
South Africa Population Forecast
| Year | Population | Yearly% Change |
Yearly Change |
Migrants (net) | Median Age | Fertility Rate | Density (P/Km²) | Urban Pop% |
Urban Population | World Population | Global Rank |
|---|---|---|---|---|---|---|---|---|---|---|---|
| 2020 | 59,308,690 | 1.38 % | 784,465 | 145,405 | 27.6 | 2.41 | 49 | 66.7% | 39,550,889 | 7,794,798,739 | 25 |
| 2025 | 62,802,683 | 1.15 % | 698,799 | 112,349 | 28.7 | 2.41 | 52 | 68.6% | 43,112,579 | 8,184,437,460 | 24 |
| 2030 | 65,956,081 | 0.98 % | 630,680 | 91,759 | 29.6 | 2.41 | 54 | 70.4% | 46,457,072 | 8,548,487,400 | 24 |
| 2035 | 68,818,987 | 0.85 % | 572,581 | 76,008 | 30.5 | 2.41 | 57 | 72.1% | 49,631,106 | 8,887,524,213 | 24 |
| 2040 | 71,375,305 | 0.73 % | 511,264 | 59,663 | 31.6 | 2.41 | 59 | 73.7% | 52,625,241 | 9,198,847,240 | 24 |
| 2045 | 73,619,543 | 0.62 % | 448,848 | 58,397 | 32.7 | 2.41 | 61 | 75.3% | 55,447,449 | 9,481,803,274 | 23 |
| 2050 | 75,517,920 | 0.51 % | 379,675 | 33.9 | 2.41 | 62 | 76.9% | 58,056,843 | 9,735,033,990 | 25 |
![]()
Main Cities by Population in South Africa
| # | CITY NAME | POPULATION | ||
|---|---|---|---|---|
| 1 | Cape Town | 3,433,441 | ||
| 2 | Durban | 3,120,282 | ||
| 3 | Johannesburg | 2,026,469 | ||
| 4 | Soweto | 1,695,047 | ||
| 5 | Pretoria | 1,619,438 | ||
| 6 | Port Elizabeth | 967,677 | ||
| 7 | Pietermaritzburg | 750,845 | ||
| 8 | Benoni | 605,344 | ||
| 9 | Tembisa | 511,655 | ||
| 10 | East London | 478,676 | ||
| 11 | Vereeniging | 474,681 | ||
| 12 | Bloemfontein | 463,064 | ||
| 13 | Boksburg | 445,168 | ||
| 14 | Welkom | 431,944 | ||
| 15 | Newcastle | 404,838 | ||
| 16 | Krugersdorp | 378,821 | ||
| 17 | Diepsloot | 350,000 | ||
| 18 | Randburg | 337,053 | ||
| 19 | Botshabelo | 309,714 | ||
| 20 | Brakpan | 305,692 | ||
| 21 | Witbank | 262,491 | ||
| 22 | Richards Bay | 252,968 | ||
| 23 | Vanderbijlpark | 246,754 | ||
| 24 | Centurion | 233,386 | ||
| 25 | Uitenhage | 228,912 | ||
| 26 | Roodepoort | 225,000 | ||
| 27 | Paarl | 190,000 | ||
| 28 | Springs | 186,394 | ||
| 29 | Carletonville | 182,304 | ||
| 30 | Klerksdorp | 178,921 | ||
| 31 | Midrand | 173,009 | ||
| 32 | Westonaria | 156,831 | ||
| 33 | Middelburg | 154,706 | ||
| 34 | Vryheid | 150,012 | ||
| 35 | Orkney | 145,801 | ||
| 36 | Kimberley | 142,089 | ||
| 37 | eMbalenhle | 141,741 | ||
| 38 | Nigel | 140,644 | ||
| 39 | Mpumalanga | 140,121 | ||
| 40 | Bhisho | 137,287 | ||
| 41 | Randfontein | 133,654 | ||
| 42 | Worcester | 127,597 | ||
| 43 | Rustenburg | 124,064 | ||
| 44 | Polokwane | 123,749 | ||
| 45 | Potchefstroom | 123,669 | ||
| 46 | Virginia | 122,502 | ||
| 47 | Brits | 122,497 | ||
| 48 | Alberton | 121,536 | ||
| 49 | Nelspruit | 110,159 | ||
| 50 | Phalaborwa | 109,468 | ||
| 51 | Queenstown | 105,309 | ||
| 52 | Kroonstad | 103,992 | ||
| 53 | Bethal | 101,919 | ||
| 54 | Mokopane | 101,090 | ||
| 55 | Mabopane | 97,417 | ||
| 56 | Kutloanong | 95,008 | ||
| 57 | Stellenbosch | 94,263 | ||
| 58 | Stilfontein | 93,110 | ||
| 59 | Delmas | 92,046 | ||
| 60 | Grahamstown | 91,548 | ||
| 61 | Warmbaths | 90,210 | ||
| 62 | Louis Trichardt | 86,854 | ||
| 63 | Dundee | 84,413 | ||
| 64 | Piet Retief | 84,349 | ||
| 65 | Phuthaditjhaba | 84,258 | ||
| 66 | Bethlehem | 83,654 | ||
| 67 | Mthatha | 78,663 | ||
| 68 | Sasolburg | 77,016 | ||
| 69 | Mmabatho | 76,754 | ||
| 70 | Standerton | 74,021 |
![]()

Related Posts