

17:01 | 15/07/2022
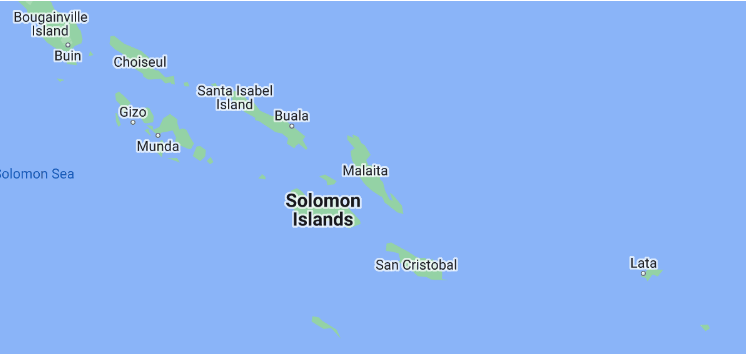
Solomon Islands. Population: 723,051
Land area: 27,990 Km2 (10,807 sq. miles). Capital: Honiara
- The current population of the Solomon Islands is 721,059 as of Friday, July 15, 2022, based on Worldometer elaboration of the latest United Nations data.
- The Solomon Islands 2020 population is estimated at 686,884 people at mid year according to UN data.
- The Solomon Islands population is equivalent to 0.01% of the total world population.
- The Solomon Islands ranks number 166 in the list of countries (and dependencies) by population.
- The population density in the Solomon Islands is 25 per Km2 (64 people per mi2).
- The total land area is 27,990 Km2 (10,807 sq. miles)
- 23.2 % of the population is urban (159,686 people in 2020)
- The median age in the Solomon Islands is 19.9 years.
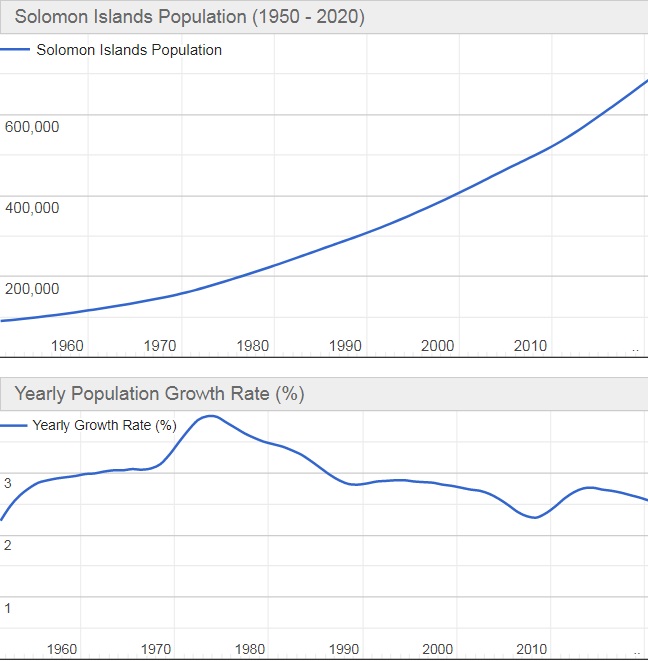
Population of the Solomon Islands (2020 and historical)
| Year | Population | Yearly% Change |
Yearly Change |
Migrants (net) | Median Age | Fertility Rate | Density (P/Km²) | Urban Pop% |
Urban Population | World Population | Global Rank |
|---|---|---|---|---|---|---|---|---|---|---|---|
| 2020 | 686,884 | 2.55 % | 17,061 | -1,600 | 19.9 | 4.44 | 25 | 23.2 % | 159,686 | 7,794,798,739 | 166 |
| 2019 | 669,823 | 2.60 % | 16,966 | -1,600 | 19.6 | 4.44 | 24 | 23.0 % | 153,795 | 7,713,468,100 | 166 |
| 2018 | 652,857 | 2.64 % | 16,818 | -1,600 | 19.6 | 4.44 | 23 | 22.7 % | 148,021 | 7,631,091,040 | 166 |
| 2017 | 636,039 | 2.68 % | 16,601 | -1,600 | 19.6 | 4.44 | 23 | 22.4 % | 142,360 | 7,547,858,925 | 166 |
| 2016 | 619,438 | 2.71 % | 16,320 | -1,600 | 19.6 | 4.44 | 22 | 22.1 % | 136,808 | 7,464,022,049 | 167 |
| 2015 | 603,118 | 2.70 % | 15,051 | -1,600 | 19.6 | 4.44 | 22 | 21.8 % | 131,361 | 7,379,797,139 | 167 |
| 2010 | 527,861 | 2.35 % | 11,589 | -2,851 | 19.5 | 4.40 | 19 | 20.0 % | 105,810 | 6,956,823,603 | 169 |
| 2005 | 469,918 | 2.63 % | 11,452 | -1,689 | 19.1 | 4.60 | 17 | 17.8 % | 83,789 | 6,541,907,027 | 169 |
| 2000 | 412,660 | 2.81 % | 10,676 | -1,057 | 18.7 | 4.91 | 15 | 15.8 % | 65,246 | 6,143,493,823 | 172 |
| 1995 | 359,281 | 2.87 % | 9,483 | -1,336 | 17.9 | 5.53 | 13 | 14.7 % | 52,678 | 5,744,212,979 | 174 |
| 1990 | 311,866 | 2.87 % | 8,216 | -1,701 | 17.0 | 6.13 | 11 | 13.7 % | 42,649 | 5,327,231,061 | 174 |
| 1985 | 270,788 | 3.27 % | 8,048 | -684 | 16.2 | 6.43 | 10 | 12.4 % | 33,669 | 4,870,921,740 | 174 |
| 1980 | 230,546 | 3.58 % | 7,429 | -483 | 16.3 | 7.04 | 8 | 10.6 % | 24,390 | 4,458,003,514 | 174 |
| 1975 | 193,402 | 3.83 % | 6,630 | 86 | 16.3 | 7.24 | 7 | 9.1 % | 17,651 | 4,079,480,606 | 175 |
| 1970 | 160,250 | 3.21 % | 4,687 | 292 | 18.2 | 6.54 | 6 | 8.9 % | 14,293 | 3,700,437,046 | 175 |
| 1965 | 136,816 | 3.03 % | 3,793 | 472 | 18.3 | 6.40 | 5 | 7.2 % | 9,914 | 3,339,583,597 | 175 |
| 1960 | 117,849 | 2.93 % | 3,169 | 630 | 18.3 | 6.40 | 4 | 5.8 % | 6,798 | 3,034,949,748 | 174 |
| 1955 | 102,002 | 2.58 % | 2,442 | 565 | 18.6 | 6.40 | 4 | 4.7 % | 4,774 | 2,773,019,936 | 175 |
Population of the Solomon Islands
| Year | Population | Yearly% Change |
Yearly Change |
Migrants (net) | Median Age | Fertility Rate | Density (P/Km²) | Urban Pop % |
Urban Population | World Population | Global Rank |
|---|---|---|---|---|---|---|---|---|---|---|---|
| 2020 | 686,884 | 2.55 % | 17,061 | -1,600 | 19.9 | 4.44 | 25 | 23.2 % | 159,686 | 7,794,798,739 | 166 |
| 2019 | 669,823 | 2.60 % | 16,966 | -1,600 | 19.6 | 4.44 | 24 | 23.0 % | 153,795 | 7,713,468,100 | 166 |
| 2018 | 652,857 | 2.64 % | 16,818 | -1,600 | 19.6 | 4.44 | 23 | 22.7 % | 148,021 | 7,631,091,040 | 166 |
| 2017 | 636,039 | 2.68 % | 16,601 | -1,600 | 19.6 | 4.44 | 23 | 22.4 % | 142,360 | 7,547,858,925 | 166 |
| 2016 | 619,438 | 2.71 % | 16,320 | -1,600 | 19.6 | 4.44 | 22 | 22.1 % | 136,808 | 7,464,022,049 | 167 |
| 2015 | 603,118 | 2.70 % | 15,051 | -1,600 | 19.6 | 4.44 | 22 | 21.8 % | 131,361 | 7,379,797,139 | 167 |
| 2010 | 527,861 | 2.35 % | 11,589 | -2,851 | 19.5 | 4.40 | 19 | 20.0 % | 105,810 | 6,956,823,603 | 169 |
| 2005 | 469,918 | 2.63 % | 11,452 | -1,689 | 19.1 | 4.60 | 17 | 17.8 % | 83,789 | 6,541,907,027 | 169 |
| 2000 | 412,660 | 2.81 % | 10,676 | -1,057 | 18.7 | 4.91 | 15 | 15.8 % | 65,246 | 6,143,493,823 | 172 |
| 1995 | 359,281 | 2.87 % | 9,483 | -1,336 | 17.9 | 5.53 | 13 | 14.7 % | 52,678 | 5,744,212,979 | 174 |
| 1990 | 311,866 | 2.87 % | 8,216 | -1,701 | 17.0 | 6.13 | 11 | 13.7 % | 42,649 | 5,327,231,061 | 174 |
| 1985 | 270,788 | 3.27 % | 8,048 | -684 | 16.2 | 6.43 | 10 | 12.4 % | 33,669 | 4,870,921,740 | 174 |
| 1980 | 230,546 | 3.58 % | 7,429 | -483 | 16.3 | 7.04 | 8 | 10.6 % | 24,390 | 4,458,003,514 | 174 |
| 1975 | 193,402 | 3.83 % | 6,630 | 86 | 16.3 | 7.24 | 7 | 9.1 % | 17,651 | 4,079,480,606 | 175 |
| 1970 | 160,250 | 3.21 % | 4,687 | 292 | 18.2 | 6.54 | 6 | 8.9 % | 14,293 | 3,700,437,046 | 175 |
| 1965 | 136,816 | 3.03 % | 3,793 | 472 | 18.3 | 6.40 | 5 | 7.2 % | 9,914 | 3,339,583,597 | 175 |
| 1960 | 117,849 | 2.93 % | 3,169 | 630 | 18.3 | 6.40 | 4 | 5.8 % | 6,798 | 3,034,949,748 | 174 |
| 1955 | 102,002 | 2.58 % | 2,442 | 565 | 18.6 | 6.40 | 4 | 4.7 % | 4,774 | 2,773,019,936 | 175 |
![]()
![]()
 << Countries around the world >>
![]()


