

17:43 | 01/06/2022
![]()
 << Countries around the world >>
![]()
Chile. Population: 19,435,355.
Land area is 743,532 Km2 (287,079 sq. miles). Capital: Santiago
![]()
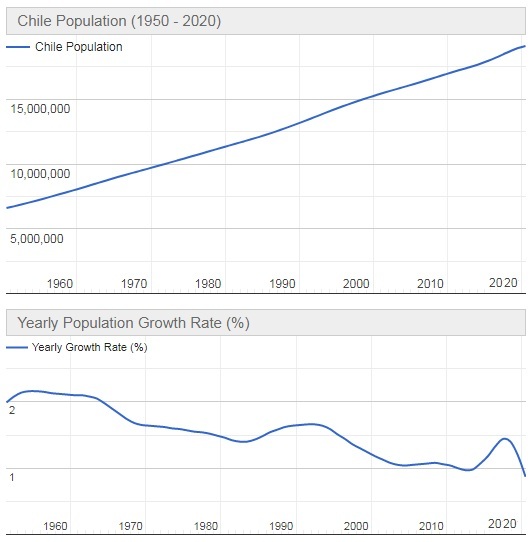
- The current population of Chile is 19,429,425 as of Wednesday, June 1, 2022, based on Worldometer elaboration of the latest United Nations data.
- Chile 2020 population is estimated at 19,116,201 people at mid year according to UN data.
- Chile population is equivalent to 0.25% of the total world population.
- Chile ranks number 63 in the list of countries (and dependencies) by population.
- The population density in Chile is 26 per Km2 (67 people per mi2).
- The total land area is 743,532 Km2 (287,079 sq. miles)
- 84.8 % of the population is urban (16,205,574 people in 2020)
- The median age in Chile is 35.3 years.
![]()
Population of Chile (2020 and historical)
| Year | Population | Yearly% Change |
Yearly Change |
Migrants (net) | Median Age | Fertility Rate | Density (P/Km²) | Urban Pop% |
Urban Population | World Population | Global Rank |
|---|---|---|---|---|---|---|---|---|---|---|---|
| 2020 | 19,116,201 | 0.87% | 164,163 | 111,708 | 35.3 | 1.65 | 26 | 84.8% | 16,205,574 | 7,794,798,739 | 63 |
| 2019 | 18,952,038 | 1.19% | 222,878 | 111,708 | 34.1 | 1.81 | 25 | 84.8% | 16,070,807 | 7,713,468,100 | 62 |
| 2018 | 18,729,160 | 1.40% | 258,721 | 111,708 | 34.1 | 1.81 | 25 | 85.1% | 15,934,214 | 7,631,091,040 | 62 |
| 2017 | 18,470,439 | 1.44% | 261,371 | 111,708 | 34.1 | 1.81 | 25 | 85.5% | 15,796,168 | 7,547,858,925 | 62 |
| 2016 | 18,209,068 | 1.33% | 239,715 | 111,708 | 34.1 | 1.81 | 24 | 86.0% | 15,657,149 | 7,464,022,049 | 61 |
| 2015 | 17,969,353 | 1.04% | 181,363 | 32,746 | 33.8 | 1.85 | 24 | 86.4% | 15,517,478 | 7,379,797,139 | 62 |
| 2010 | 17,062,536 | 1.06% | 175,963 | 21,434 | 32.2 | 1.90 | 23 | 86.7% | 14,796,864 | 6,956,823,603 | 60 |
| 2005 | 16,182,721 | 1.07% | 168,074 | 8,466 | 30.5 | 1.95 | 22 | 86.6% | 14,012,965 | 6,541,907,027 | 61 |
| 2000 | 15,342,353 | 1.30% | 192,297 | 3,868 | 28.7 | 2.20 | 21 | 85.6% | 13,137,147 | 6,143,493,823 | 61 |
| 1995 | 14,380,866 | 1.61% | 221,249 | 722 | 27.0 | 2.52 | 19 | 84.0% | 12,087,036 | 5,744,212,979 | 57 |
| 1990 | 13,274,623 | 1.61% | 203,477 | -13,730 | 25.7 | 2.60 | 18 | 83.1% | 11,026,799 | 5,327,231,061 | 54 |
| 1985 | 12,257,236 | 1.43% | 167,578 | -30,904 | 24.3 | 2.63 | 16 | 82.1% | 10,064,404 | 4,870,921,740 | 55 |
| 1980 | 11,419,348 | 1.51% | 165,408 | -29,660 | 22.9 | 2.94 | 15 | 80.2% | 9,153,051 | 4,458,003,514 | 54 |
| 1975 | 10,592,307 | 1.60% | 161,835 | -32,252 | 21.6 | 3.47 | 14 | 77.2% | 8,179,999 | 4,079,480,606 | 53 |
| 1970 | 9,783,134 | 1.71% | 158,703 | -39,300 | 20.6 | 4.08 | 13 | 73.5% | 7,194,621 | 3,700,437,046 | 54 |
| 1965 | 8,989,621 | 2.02% | 171,326 | -29,380 | 20.4 | 4.58 | 12 | 68.7% | 6,178,103 | 3,339,583,597 | 53 |
| 1960 | 8,132,990 | 2.12% | 162,068 | -25,822 | 20.6 | 4.75 | 11 | 64.4% | 5,234,614 | 3,034,949,748 | 54 |
| 1955 | 7,322,652 | 2.10% | 144,826 | -24,791 | 20.7 | 4.85 | 10 | 59.7% | 4,368,840 | 2,773,019,936 | 53 |
![]()
Chile Population Forecast
| Year | Population | Yearly% Change |
Yearly Change |
Migrants (net) | Median Age | Fertility Rate | Density (P/Km²) | Urban Pop% |
Urban Population | World Population | Global Rank |
|---|---|---|---|---|---|---|---|---|---|---|---|
| 2020 | 19,116,201 | 1.25% | 229,370 | 111,708 | 35.3 | 1.65 | 26 | 84.8% | 16,205,574 | 7,794,798,739 | 63 |
| 2025 | 19,240,993 | 0.13% | 24,958 | -72,000 | 37.7 | 1.65 | 26 | 87.6% | 16,850,412 | 8,184,437,460 | 66 |
| 2030 | 19,458,103 | 0.22% | 43,422 | -28,800 | 39.8 | 1.65 | 26 | 89.7% | 17,445,524 | 8,548,487,400 | 70 |
| 2035 | 19,879,425 | 0.43% | 84,264 | 32,000 | 41.8 | 1.65 | 27 | 90.4% | 17,962,170 | 8,887,524,213 | 70 |
| 2040 | 20,156,644 | 0.28% | 55,444 | 24,000 | 43.5 | 1.65 | 27 | 91.3% | 18,407,343 | 9,198,847,240 | 73 |
| 2045 | 20,296,679 | 0.14% | 28,007 | 16,000 | 45.0 | 1.65 | 27 | 92.5% | 18,767,601 | 9,481,803,274 | 76 |
| 2050 | 20,319,307 | 0.02% | 4,526 | 46.1 | 1.65 | 27 | 93.6% | 19,027,962 | 9,735,033,990 | 76 |
![]()
Main Cities by Population in Chile
| # | CITY NAME | POPULATION | ||
|---|---|---|---|---|
| 1 | Santiago | 4,837,295 | ||
| 2 | Puente Alto | 510,417 | ||
| 3 | Antofagasta | 309,832 | ||
| 4 | Vina del Mar | 294,551 | ||
| 5 | Valparaiso | 282,448 | ||
| 6 | Talcahuano | 252,968 | ||
| 7 | San Bernardo | 249,858 | ||
| 8 | Temuco | 238,129 | ||
| 9 | Iquique | 227,499 | ||
| 10 | Concepcion | 215,413 | ||
| 11 | Rancagua | 212,695 | ||
| 12 | La Pintana | 201,178 | ||
| 13 | Talca | 197,479 | ||
| 14 | Arica | 185,999 | ||
| 15 | Coquimbo | 161,317 | ||
| 16 | Puerto Montt | 160,054 | ||
| 17 | La Serena | 154,521 | ||
| 18 | Chillan | 150,396 | ||
| 19 | Calama | 143,084 | ||
| 20 | Osorno | 135,773 | ||
| 21 | Valdivia | 133,419 | ||
| 22 | Quilpue | 130,263 | ||
| 23 | Copiapo | 129,280 | ||
| 24 | Los Angeles | 125,430 | ||
| 25 | Punta Arenas | 117,430 | ||
| 26 | Lo Prado | 104,316 | ||
| 27 | Curico | 102,438 | ||
| 28 | Villa Alemana | 97,320 | ||
| 29 | Coronel | 92,940 | ||
| 30 | San Antonio | 85,651 | ||
| 31 | Chiguayante | 82,545 | ||
| 32 | Ovalle | 77,138 | ||
| 33 | Linares | 69,535 | ||
| 34 | Quillota | 67,779 | ||
| 35 | Penaflor | 65,495 | ||
| 36 | Melipilla | 63,100 | ||
| 37 | San Felipe | 59,294 | ||
| 38 | Los Andes | 56,859 | ||
| 39 | Buin | 55,441 | ||
| 40 | Talagante | 51,764 | ||
| 41 | Lota | 49,763 | ||
| 42 | Hacienda La Calera | 49,106 | ||
| 43 | Tome | 46,698 | ||
| 44 | Penco | 46,091 | ||
| 45 | Coyhaique | 45,787 | ||
| 46 | Vallenar | 44,895 | ||
| 47 | Angol | 44,856 | ||
| 48 | Rengo | 38,100 | ||
| 49 | Constitucion | 37,917 | ||
| 50 | Limache | 35,876 | ||
| 51 | Santa Cruz | 33,283 | ||
| 52 | Paine | 32,766 | ||
| 53 | Villarrica | 31,602 | ||
| 54 | San Carlos | 31,517 | ||
| 55 | Cauquenes | 31,362 | ||
| 56 | Curanilahue | 30,611 | ||
| 57 | Las Animas | 30,000 | ||
| 58 | Castro | 29,926 | ||
| 59 | San Vicente de Tagua Tagua | 29,560 | ||
| 60 | Lampa | 29,250 | ||
| 61 | Molina | 28,775 | ||
| 62 | Ancud | 28,020 | ||
| 63 | Machali | 27,595 | ||
| 64 | Pucon | 26,953 | ||
| 65 | Parral | 26,904 | ||
| 66 | La Union | 26,298 | ||
| 67 | Puerto Varas | 24,958 | ||
| 68 | La Ligua | 24,857 | ||
| 69 | Arauco | 24,659 | ||
| 70 | Victoria | 24,555 |
![]()

Related Posts


