

17:35 | 04/06/2022
![]()
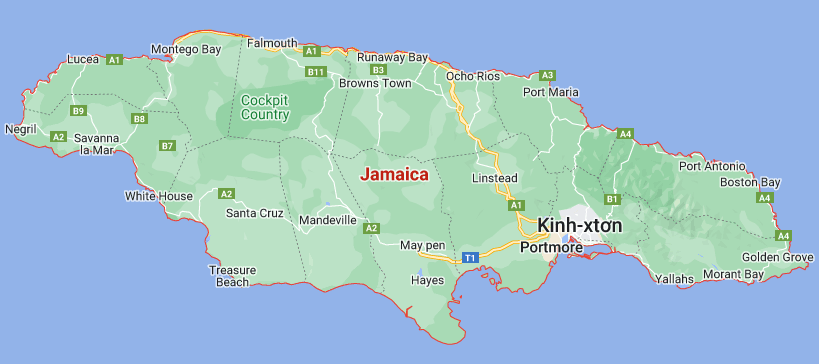
Jamaica. Population: 2,986,174.
Land area: 10,830 Km2 (4,181 sq. miles). Capital: Kingston
- The current population of Jamaica is 2,985,943 as of Saturday, June 4, 2022, based on Worldometer elaboration of the latest United Nations data.
- Jamaica 2020 population is estimated at 2,961,167 people at mid year according to UN data.
- Jamaica population is equivalent to 0.04% of the total world population.
- Jamaica ranks number 138 in the list of countries (and dependencies) by population.
- The population density in Jamaica is 273 per Km2 (708 people per mi2).
- The total land area is 10,830 Km2 (4,181 sq. miles)
- 55.4 % of the population is urban (1,640,435 people in 2020)
- The median age in Jamaica is 30.7 years.
![]()
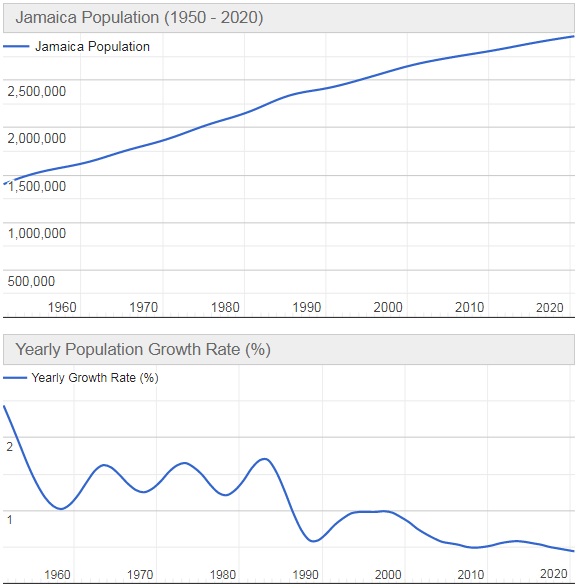
Population of Jamaica (2020 and historical)
| Year | Population | Yearly% Change |
Yearly Change |
Migrants (net) | Median Age | Fertility Rate | Density (P/Km²) | Urban Pop% |
Urban Population | World Population | Global Rank |
|---|---|---|---|---|---|---|---|---|---|---|---|
| 2020 | 2,961,167 | 0.44 % | 12,888 | -11,332 | 30.7 | 1.99 | 273 | 55.4% | 1,640,435 | 7,794,798,739 | 138 |
| 2019 | 2,948,279 | 0.46 % | 13,432 | -11,332 | 29.4 | 2.06 | 272 | 55.2% | 1,627,119 | 7,713,468,100 | 138 |
| 2018 | 2,934,847 | 0.48 % | 13,999 | -11,332 | 29.4 | 2.06 | 271 | 55.0% | 1,613,815 | 7,631,091,040 | 139 |
| 2017 | 2,920,848 | 0.50 % | 14,612 | -11,332 | 29.4 | 2.06 | 270 | 54.8% | 1,600,602 | 7,547,858,925 | 139 |
| 2016 | 2,906,236 | 0.53 % | 15,215 | -11,332 | 29.4 | 2.06 | 268 | 54.6% | 1,587,568 | 7,464,022,049 | 139 |
| 2015 | 2,891,021 | 0.57 % | 16,112 | -11,332 | 29.0 | 2.08 | 267 | 54.5% | 1,574,768 | 7,379,797,139 | 140 |
| 2010 | 2,810,460 | 0.51 % | 14,091 | -17,464 | 27.5 | 2.28 | 260 | 53.9% | 1,514,064 | 6,956,823,603 | 140 |
| 2005 | 2,740,003 | 0.63 % | 17,060 | -18,409 | 26.2 | 2.45 | 253 | 52.9% | 1,449,489 | 6,541,907,027 | 138 |
| 2000 | 2,654,701 | 0.94 % | 24,198 | -18,656 | 24.9 | 2.70 | 245 | 51.9% | 1,376,634 | 6,143,493,823 | 136 |
| 1995 | 2,533,711 | 0.92 % | 22,761 | -22,014 | 23.5 | 2.84 | 234 | 50.7% | 1,284,333 | 5,744,212,979 | 134 |
| 1990 | 2,419,906 | 0.71 % | 16,879 | -29,387 | 22.2 | 3.10 | 223 | 49.5% | 1,198,630 | 5,327,231,061 | 133 |
| 1985 | 2,335,510 | 1.55 % | 34,533 | -14,217 | 20.6 | 3.55 | 216 | 48.5% | 1,132,462 | 4,870,921,740 | 132 |
| 1980 | 2,162,846 | 1.30 % | 26,966 | -19,697 | 19.5 | 4.00 | 200 | 46.7% | 1,010,985 | 4,458,003,514 | 132 |
| 1975 | 2,028,016 | 1.57 % | 30,475 | -18,207 | 17.4 | 5.00 | 187 | 44.0% | 892,476 | 4,079,480,606 | 131 |
| 1970 | 1,875,642 | 1.32 % | 23,826 | -29,948 | 17.2 | 5.78 | 173 | 41.3% | 774,985 | 3,700,437,046 | 129 |
| 1965 | 1,756,511 | 1.52 % | 25,598 | -28,788 | 18.6 | 5.64 | 162 | 37.5% | 658,574 | 3,339,583,597 | 122 |
| 1960 | 1,628,520 | 1.11 % | 17,513 | -29,969 | 19.8 | 5.08 | 150 | 33.8% | 549,842 | 3,034,949,748 | 126 |
| 1955 | 1,540,956 | 1.89 % | 27,611 | -7,788 | 22.0 | 4.22 | 142 | 28.7% | 442,709 | 2,773,019,936 | 122 |
![]()
Jamaica Population Forecast
| Year | Population | Yearly% Change |
Yearly Change |
Migrants (net) | Median Age | Fertility Rate | Density (P/Km²) | Urban Pop% |
Urban Population | World Population | Global Rank |
|---|---|---|---|---|---|---|---|---|---|---|---|
| 2020 | 2,961,167 | 0.48% | 14,029 | -11,332 | 30.7 | 1.99 | 273 | 55.4% | 1,640,435 | 7,794,798,739 | 138 |
| 2025 | 3,015,321 | 0.36% | 10,831 | -11,332 | 32.7 | 1.99 | 278 | 56.6% | 1,706,544 | 8,184,437,460 | 138 |
| 2030 | 3,047,974 | 0.22% | 6,531 | -11,332 | 34.7 | 1.99 | 281 | 58.1% | 1,769,809 | 8,548,487,400 | 139 |
| 2035 | 3,057,896 | 0.07% | 1,984 | -11,332 | 36.8 | 1.99 | 282 | 59.7% | 1,827,045 | 8,887,524,213 | 139 |
| 2040 | 3,045,162 | -0.08% | -2,547 | -11,332 | 38.7 | 1.99 | 281 | 61.4% | 1,870,747 | 9,198,847,240 | 141 |
| 2045 | 3,011,815 | -0.22% | -6,669 | -11,332 | 40.3 | 1.99 | 278 | 63.0% | 1,896,280 | 9,481,803,274 | 142 |
| 2050 | 2,960,317 | -0.34% | -10,300 | 41.5 | 1.99 | 273 | 64.3% | 1,904,123 | 9,735,033,990 | 142 |
![]()
Main Cities by Population in Jamaica
| # | CITY NAME | POPULATION | ||
|---|---|---|---|---|
| 1 | Kingston | 937,700 | ||
| 2 | New Kingston | 583,958 | ||
| 3 | Spanish Town | 145,018 | ||
| 4 | Portmore | 102,861 | ||
| 5 | Montego Bay | 82,867 | ||
| 6 | Mandeville | 47,115 | ||
| 7 | May Pen | 44,755 | ||
| 8 | Old Harbour | 26,024 | ||
| 9 | Linstead | 20,660 | ||
| 10 | Half Way Tree | 18,552 | ||
| 11 | Savanna-la-Mar | 16,553 |
![]()
![]()
 << Countries around the world >>
![]()
Related Posts


